Intro
We know that monitoring user endpoints is a big deal and sort of problematic. I think most would agree that the easiest and cheapest way right now to monitor Windows endpoints is via Windows Event Forwarding or (WEF) .
If you are unfamiliar with the technology, I recommend reading the following:
- Windows event forwarding for network defense
- Spotting the adversary with Windows Event Logging
- ArcSight Collecting Widnows Events Logs
Setting up the technology is sort of straight forward process. Yet, after using it for some time, you will try to find a way to monitor your whole setup more closely. It is always useful to know, how many endpoints are sending events, are there active endpoints, that do not send events and etc. Unfortunatelly ArcSight’s Management Center to monitor WEF sources is not enough. That is why I have decided to build my own basic operational dashboard to enable WEF monitoring.
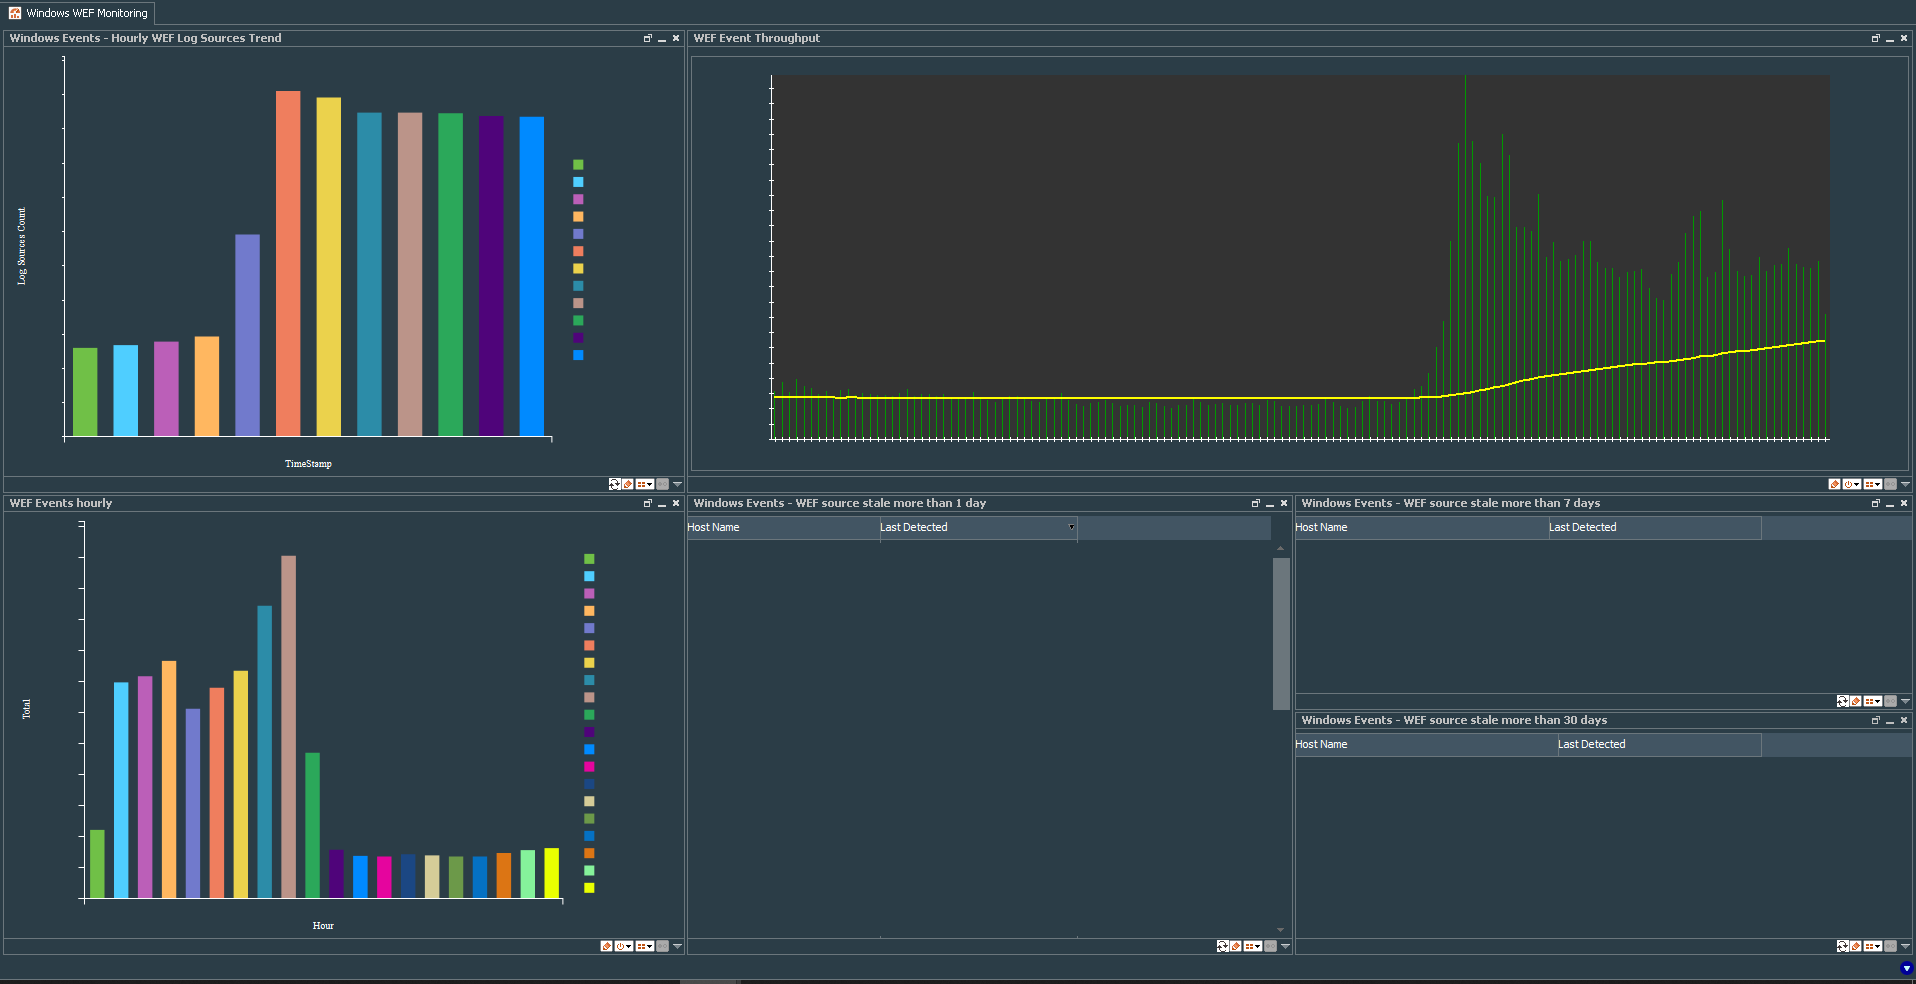
This dashboard shows me information about endpoints that do not send events for several days, number of WEF log sources sending events per hour, total number of events per hour and event throughput.
Below are the steps to build the same in your ArcSight Environment.
Counting WEF log sources per hour
We begin with the interesting task - counting the number of log sources per hour, something ArcSight, as far as I know, cannot do with a standard data monitor.
As usual, I like to start with the common filter. I called it Windows Events - WEF Log sources count and its conditions specify deviceVendor=Microsoft and agentId=Name of the Connector. This filter will play important role for our dashboard.
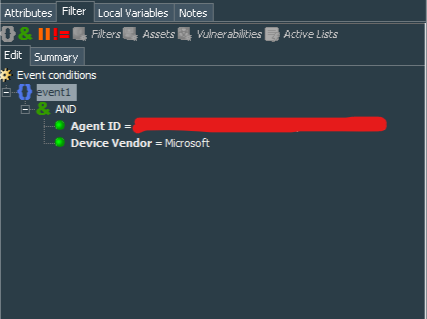
Next we should create a query that extracts and calculates count of event sources, based on their IP address (although you may also use hostname as the count basis), for one hour. Let’s call it Windows Events - WEF Log Sources, it should work on events with startTime set to “$Now-1h” and endTime to “$Now”.
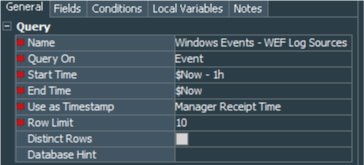
Its conditions match our Windows Events - WEF Log sources count filter.

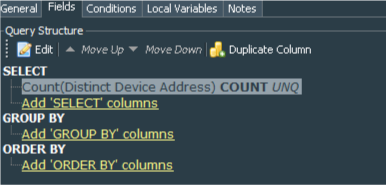
We extract deviceAddress from the event and apply Count function with Unique to it.
After creating the query we procced to creation of the trend. This trend will help us track changes in number of the endpoints sending events every hour. I called it Windows Events - WEF Log Soures Count, its Trend Interval equals 1 hour and rest is left as default.
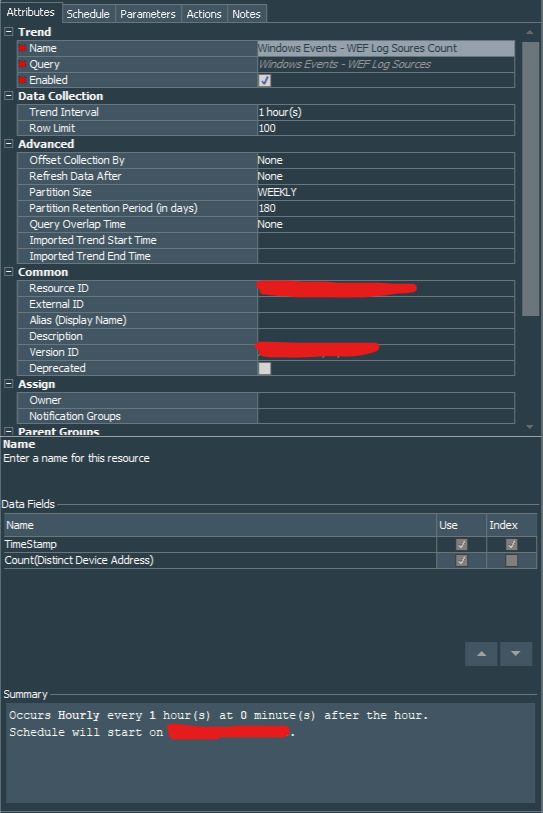
Trend is scheduled to run every 1 hour with no End Date.
I have changed trend’s parameters startTime to “$Now-1h” and left the rest as default settings.

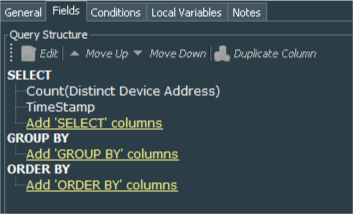
In order to extract data from the trend we create another query, which I have called Windows Events - Hourly WEF Log Sources trend. We need data for the last 12 hours, so startTime equals to “$Now-13h” and endTime to “$Now”, row limit set to 15.

We need both Count(Distinct Device Address) and TimeStamp fields from the trend.
To visualize the results let’s create a query viewer, that shows us data based on the last query results. I called the Query Viewer - Windows Events - Hourly WEF Log Sources Trend, it refreshes every hour (cause it does not make sense to refresh it at quicker periods) and the parameters are left as default.

I renamed Count(Distinct Device Address) column to Log Sources Count and left TimeStamp as it is.
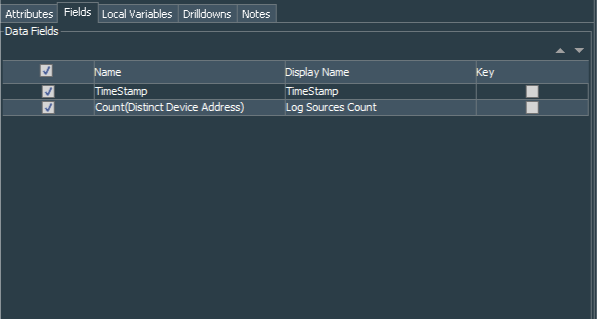
This Query Viewer will be used in our dashboard to show how many endpoints are sending events per hour.
Calculating WEF Event throughput and total hourly count of WEF events
To monitor WEF events and its trends I find it neccessary to know how many events are being collected at every hour as well as its average throughput. This can be achieved with standard ArcSight data monitors.
The first data monitor called WEF Events Hourly. It is Hourly Counts type. Simply define our base Windows Events - WEF Log sources count filter in the Restrict by Filter field, set Availability Interval to 300 seconds, and enable it.

Next, create another data monitor, call it WEF Event Throughput as Moving Average type. Set Restricted by Filter to the Windows Events - WEF Log sources count filter, Value Calculation to Average value per minute. Group By field should be empty and Sort By set to Field Values. Leave Alarm Change Threashold(%) as default 50%. Number of Samples I have set to 144, Number of Visible Groups to 15, Sampling Interval to 600,and Group Discard Threshold as well as Maximum Alarm Frequency are left as default 10 and 300 respectively.
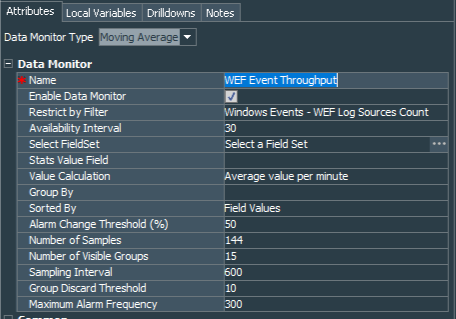
Do not forget to enable the monitor and it will collect all events restricted by our base filter over 144 samples with 600 seconds (10 minutes) interval and calculate moving average.
These two monitors along with our count of endpoints per hour metric, should be sufficient enough to monitor the stability performance and efficiency of our event collection. It also helps observe how many endpoints communicate and send events to our SIEM.
Finding stale endpoints, that do not send events for 1, 7 and 30 days.
Afer using WEF for some time, I needed to track endpoints that have not sending events for long periods of time.
To achieve this task you will need several rules and several Active Lists.
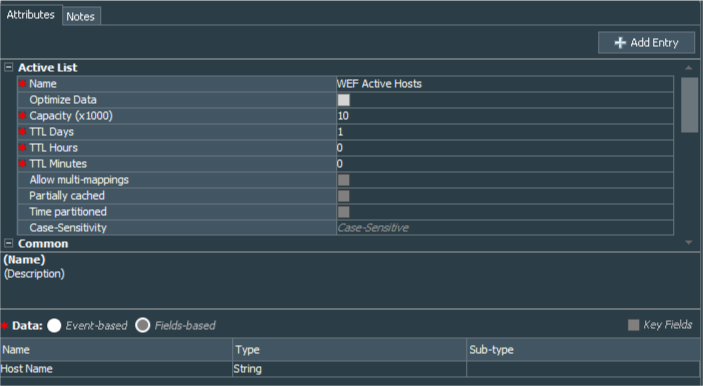
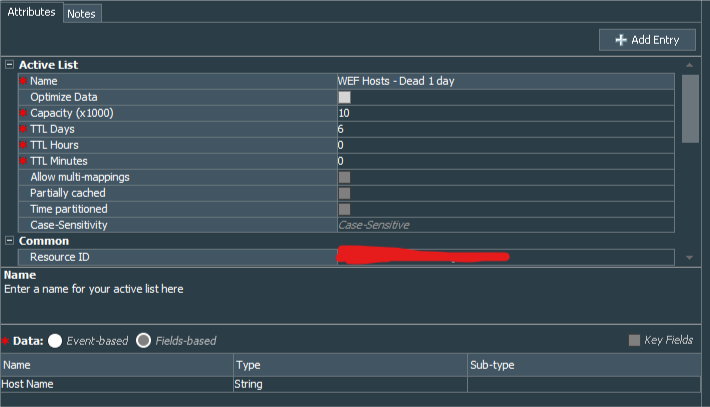
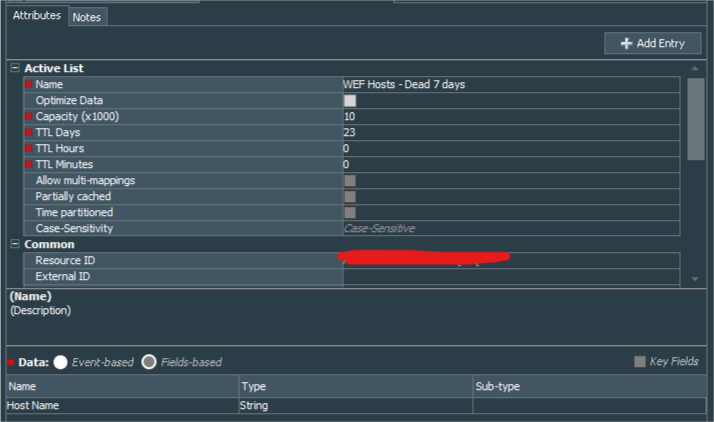
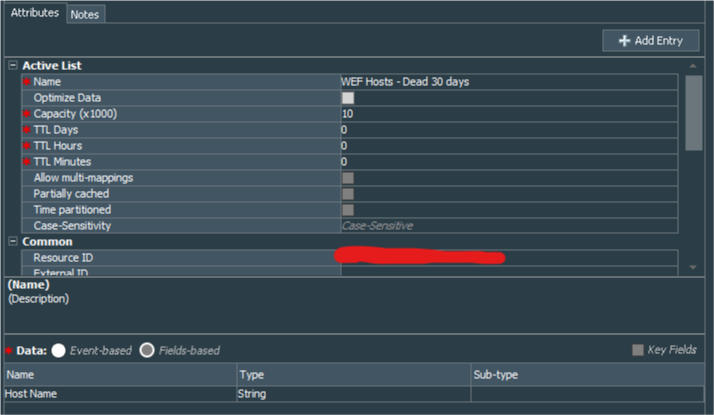
At first we need to create 4 fields-based active lists WEF Active Hosts, WEF Hosts - Dead 1 day, WEF Hosts - Dead 7 days, WEF Hosts - Dead 30 days. All are with the same structure:
| Active List Field Name | Field Type | Key-Field |
|---|---|---|
| Host Name | String | N |
For each list we need to change TTL Days:
| Active List Name | TTL Days |
|---|---|
| WEF Active Hosts | 1 |
| WEF Hosts - Dead 1 day | 6 |
| WEF Hosts - Dead 7 days | 23 |
| WEF Hosts - Dead 30 days | 0 |
That means that entries to the fisrt three Active Lists will expire after 1, 6, and 7 days respectively tracking the dead hosts up to 30 days in total. Entries in the WEF Hosts - Dead 30 days list will remain until host starts sending events or unril you decide to delete the entry manually.
Config examples below:
 |
 |
 |
 |
Now, after the tracking backbone is created we move onto the actual muscles that input and move data from one list to another.
The first should be lightweight rule that would catch any event coming from the active host and record that fact to the WEF Active Hosts Active List.

In certain cases I prefer to bring string values to lower case, so there is a Local Variable for the rule that lowers deviceHostName event field.
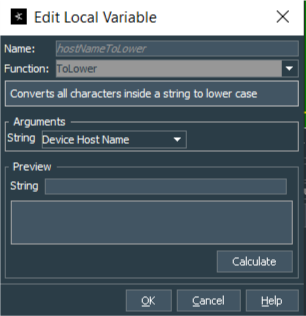
Finally the actions for this rule will be to add entry to the WEF Active Hosts Active List in case of receiving event from live host and remove the hostname from other active lists in case it is found there.
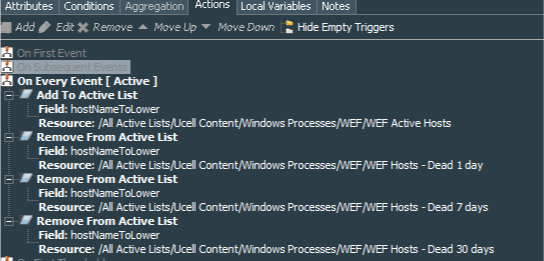
As you can see the logic is simple. Every event received from the host means that host is alive and sending events, so it is recorded in the list controling the active hosts and simultaneously deleted from any list keeping track of the dead hosts. Entries to this list expire after 24 hours since the last detected event, meaning that in case host does not send an event in 24 hours, its entry would be removed from the WEF Active Hosts active list.
When entry expires from the active list, ArcSight ESM generates the internal event under the name “ActiveList entry expired”. To detect a dead host among WEF sources we need to catch such event for the specific list. So we create a standard rule Windows Events - 1 day stale WEF host detected and its conditions are: name=ActiveList entry expired AND fileName=WEF Active Hosts AND fileType=ActiveList. Obviously if you have named your active list recording live hosts differently you should set fileName to the name you have chosen.
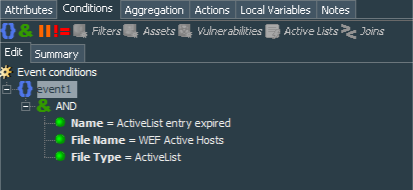
Rule’s action should record value of the deviceCustomString4 to the Host Name column of the WEF Hosts - Dead 1 day Active List.

Do not forget that in order to correctly process this field, events should have aggregation setup, so in our example we aggregate events with identical deviceCustomString4 fields with # of Matches = 1 and Time Frame = 1 Minute.
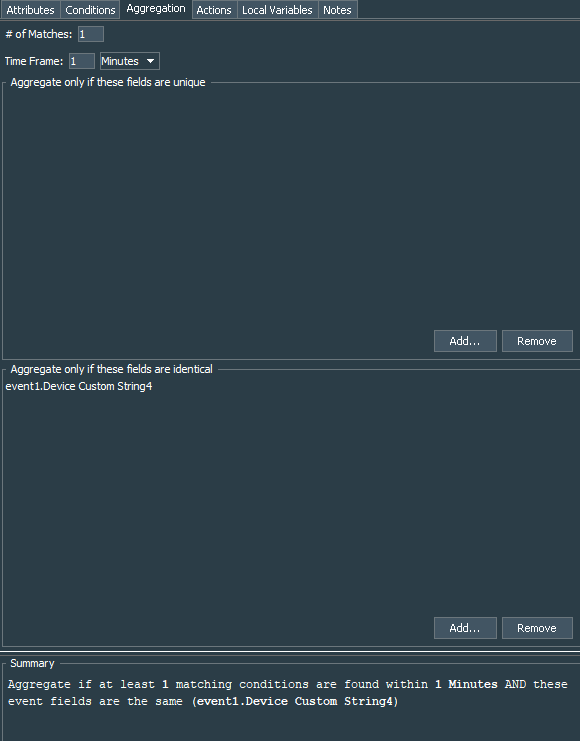
If you followed the logic you understand that our rule catches event indicating that entry expired from the WEF Active Hosts Active List, meaning that host did not send a single event for 24 hours and therefore is considered dead. Details of the entry expired are recorded to the deviceCustomString4 value of the “ActiveList entry expired” event. Rule picks up value of the deviceCustomString4 field and updates WEF Hosts - Dead 1 day Active List with its value. That way we start tracking those endpoints that do not send events for more than 24 hours.
Recall that TTL for our first three active lists are set to 1, 6 and 23 days, meaning that we will track endpoints not sending events for more than 1, 7 and 30 days in its respective lists. So we need to create two more rules to catch events of entries expiring from the WEF Hosts - Dead 1 day, WEF Hosts - Dead 7 days active lists. These two new rules should be identical to the Windows Events - 1 day stale WEF host detected, changing only rule name and active list name value in the conditions and actions.
Create Windows Events - 7 day stale WEF host detected with conditions equal to name=ActiveList entry expired AND fileName=WEF Hosts - Dead 1 day AND fileType=ActiveList and Windows Events - 30 day stale WEF host detected with conditions equal to name=ActiveList entry expired AND fileName=WEF Hosts - Dead 7 day AND fileType=ActiveList.
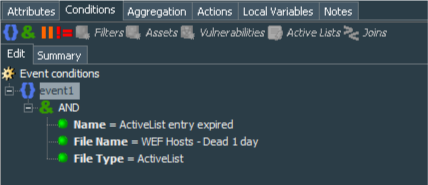
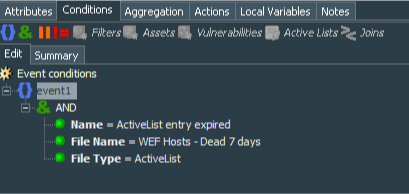
Aggregation for both rules is set to aggregate events with identical deviceCustomString4 fields with # of Matches = 1 and Time Frame = 1 Minute.

Both rules’ action tab should record value of the deviceCustomString4 to the Host Name column of the WEF Hosts - Dead 7 days and WEF Hosts - Dead 30 days Active Lists.


These 4 rules in total create the logic of detecting stale hosts. Move them to the Real-time Rules folder and enable. That concludes the first part of our configuration.
Now that we have backbone logic configured, let’s proceed to the visualization of our results.
The main data we need is stored within 3 Active Lists, so we need to create 3 queries - Windows Events - 1 day stale host, Windows Events - 7 day stale host and Windows Events - 30 day stale host, each quering WEF Hosts - Dead 1 day, WEF Hosts - Dead 7 days, WEF Hosts - Dead 30 days Active Lists respectively, extracting Host Name and Last Modified Time column values from each.
Below is the example for the Windows Events - 1 day stale host Query.

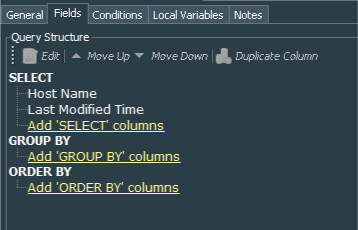
After queries configuration is done we need to create 3 Query Viewers - Windows Events - WEF source stale more than 1 day,Windows Events - WEF source stale more than 7 days,Windows Events - WEF source stale more than 30 days. These viewers extract data from our Windows Events - 1 day stale host, Windows Events - 7 day stale host and Windows Events - 30 day stale host queries. For each of them I have set refresh data to 5 minutes and Default View to Table . I have also changed Display Name for the Last Modified Time column to Last Detected .
You can see the example for the Windows Events - WEF source stale more than 1 day Query Viewer below:


Final steps
OK. Finally we need to combine everything into a single dashboard, so add:
- Windows Events - Hourly WEF Log Sources Trend Query Viewer as Bar Chart
- WEF Events Hourly Data Monitor as Bar Chart
- WEF Event Throughput Data Monitor as Tile
- Windows Events - WEF source stale more than 1 day, Windows Events - WEF source stale more than 7 days, Windows Events - WEF source stale more than 30 days Query Viewers as tables.
Mine looks like this (clickable to zoom):
Mentions
Photo by Gabriel Crismariu on Unsplash


