

AnyConnect VPN Correlation Rule Pack - Part 3.
OK. So far we were trying to set rules and correlate proper evetns. This final part of the VPN rule pack will deal with the dashboard and some reporting.
One of the most important steps in content development reserved for presenting the information that makes sense to your evironment. My dashboard will be quite simple, it will show active VPN sessions and count of the successful VPN connections per hour for the last 24 hours.
Additionally I will configure two reports showing daily successful connections from public IPs and IPs accessed internally from the VPN addresses.
Lets begin with the dashboard.
Connections over the last 24 hours.
To calculate number of connections I have decided to use Session lists. So lets create the VPN Events - VPN Session list. The session list is key and case-insensitive and has 3 fields defined:
| Field Name | Field Type | Key-Field |
|---|---|---|
| NAS Port | String | Y |
| Source IP Address | IP Address | N |
| User Name | String | N |

Ok. This session list will give us a view of the session start and end time as well as a chance to calculate session length, which I think is a useful thing to see, especially if your policy specifies this length.
Now, we will reuse some rules that were created earlier: VPN Events - ASC Session Start and VPN Events - ASC Session Stop. The first one will add to the session list and the former will terminate the session.


Next, we are going to create a query VPN Events - Connection Counts Last Hour. It will work on the session list that we have create and look for the count of records for 1 hour without any specific conditions.


As you can see, I make simple count of the NAS Port field of the session list. The reason is because I am sure that it is unique.
Based on the above query we define trend VPN Events - Hourly Connection Count. This trend will collect data from the query every hour.


This trend will allow us collect number of connections for each hour and we will be able to create another query VPN Events - Hourly Connection Trend that is simply extracting this data from the trend.


Next, create the query viewer called VPN Events - Connections Last 24 Hours by Hour that uses the VPN Events - Hourly Connection Trend query and starts with Now - 26 hours and ends with Now parameters.


Finally we right click the query viewer that was created, select Add to Dashboard As, and Bar Chart. Choose TimeStamp as the X Axis, Count(Nas Port) as the Y Axis and you are done. Do not forget to save the newly created dashboard.
Active VPN Connections
The second piece of the dashboard is less complex and will reuse the same session list.
Let’s create the VPN Events - Active Sessions Length query that again works on the session list VPN Events - VPN Session, but this time it will extract Source IP Address, Start Time, End Time, and two variables sessionLength and userNametoLower. Because we want to see only active session, we must specify in the conditions that End Time should be NULL.


sessionLength variable works like this. We create currentTime variable that uses GetCurrentTime function under the Timestamp section. Next sessionLength variable is TimeDifference function under the same Timestamp section and it compares currentTime variable with startTime list field.

userNametoLower variable is a string ToLower function that works on the User Name list field.

Next, create the query viewer called VPN Events - Active VPN Sessions that uses VPN Events - Active Sessions Length. I defined refresh rate at 1 minute, because I would like to get updates on this piece of the dashboard as quickly as possible.


This query viewer we add to the dashboard created earlier as the table and save the dashboard. This concludes work with the VPN dashboard.
Next we move onto the reports.
Report of the daily successful connections.
This report will show us the successful connections from the public IPs and map them to the internally assigned VPN address.
Lets begin with creation of the VPN Events - AnyConnect Session Established filter. This filter shows correlation events generated by the rule that we have created earlier VPN Events - AnyConnect Session Established with deviceEventClassId=rule:101. I prefer to specify events generated by the rule with the generatorId field where value is the Resource ID of the rule (find it in the Attributes tab of the rule)

We continue by creating the query called VPN Events - AnyConnect Daily Successful Connections that queries the events generated 1 day before based on the filter we did create for the fields:
- End Time
- Target User Name
- Target Translated Address
- Attacker Address
- Device Custom String 3
- Device Custom String 4
- Attacker Geo Country Code


We have everything to create our first report VPN Events - AnyConnect Daily Successful Connections. I use Chart and Table Portrait template. For the table I use VPN Events - AnyConnect Daily Successful Connections query that we was created earlier.

For the chart I reuse the VPN Events - Hourly Connection Trend query. Timestamp is used for the X Axis and Count(NAS Port) for the Y Axis. I also uncheck Show Legend check box under the Display Options tab.
Define report format (I suggest XLS or PDF) and email addresses. Create the Job to run the report on the daily basis. Done, the first report is ready. Use Preview option to test it.
Report of the internally accessed addresses.
This report will show internally accessed addresses and map them to the internally assigned VPN addresses. This report shall be more complex than the previous one. Create a filter called VPN Events - Addresses Accessed Internally that would match VPN Events - All VPN Events created earlier and has sourceAddress is NOT NULL, categoryOutcome =/Success, categoryBehavior containing /Access and other conditions.

Create Active List VPN Accessed Addresses with the following fields:
| Active List Field Name | Field Type | Key-Field |
|---|---|---|
| Access Time | Date | Y |
| Source IP Address | IP Address | N |
| Source Port | Integer | N |
| Destination IP Address | IP Address | N |
| Destination Port | Integer | N |

I have TTL Days limited to 1, because I do not want to track information longer than 1 day and prefer to save memory. This active list will feed information to our report via two different queries.
This active list will be updated by the lightweight rule VPN Events - Addresses Accessed Internally. Its conditions will match filter that we created.

Rule action will update active list VPN Accessed Addresses.
| ESM Event Field | Active List Field Name |
|---|---|
| _endTime_ | Access Time |
| _sourceAddress_ | Source Address |
| _sourcePort_ | Source Port |
| _destinationAddress_ | Destination Address |
| _destinationPort_ | destination Port |

We proceed by creating a query called VPN Events - Daily top 10 internally accessed addresses. This query will collect data from the active list that we just created and show us top 10 addresses that are accessed for the previous day. Query is very simple it collects Destination Address from the list and sum of each Count field. I have grouped it by the Destination Address and ordered by the sum of the counts.


For the second report we need another query VPN Events - Internally Accessed Addresses from the same active list that will actually present all the internal addresses and ports accessed, so we need to select destinationAddress, destinationPort, sourceAddress fields and make count of the sourceAddress fields. This time I group data by the sourceAddress, destinationAddress, destinationPort.


Now both queries are ready for the report VPN Events - Daily Internally Accessed Addresses, I will again use Chart and Table Portrait template. For the table I use VPN Events - Internally Accessed Addresses query that we was created earlier and for the chart VPN Events - Daily top 10 internally accessed addresses query.
Table definition is pretty straight forward. I group data by sourceAddress and sort from the highest to the lowest by Count(sourceAddress)

Chart will use destinationAddress for the X Axis and Sum(Count) for the Y Axis
Again define report format (I suggest XLS) and email addresses.Yo need to create again the Job to run the report on the daily basis. Do not forget to use preview to test it before defining the Job.
That is. The VPN monitoring content pack is done. That shold be enough to kickstart your VPN monitoring efforts and provide basis to work out further content.
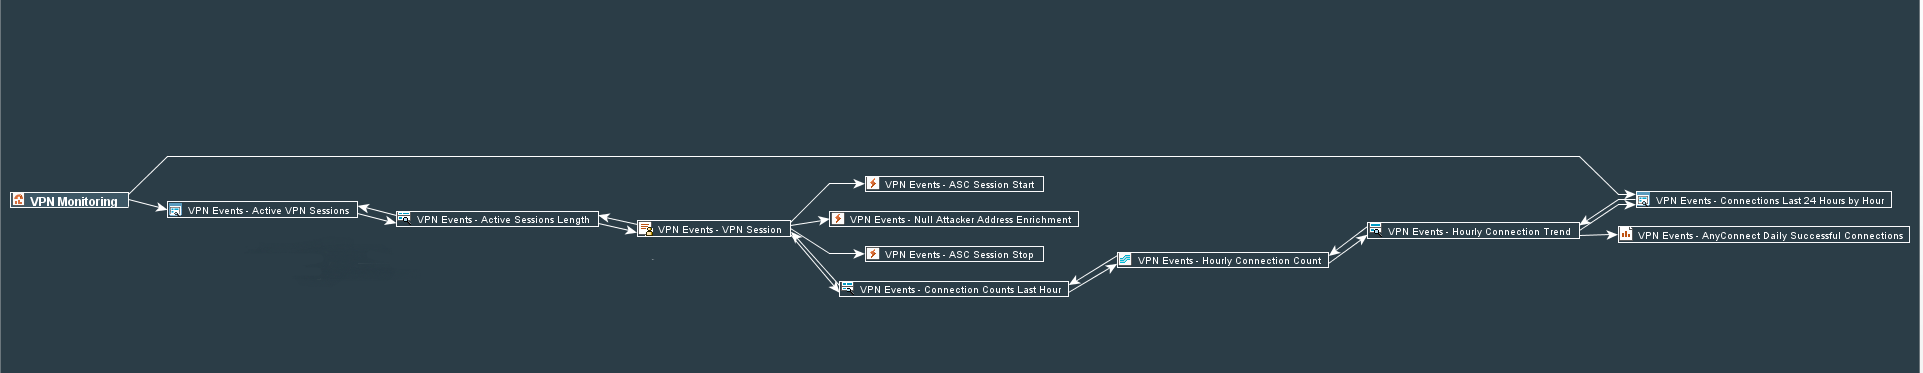
Here is the overall graph view of all the components developed in these three parts.
Mentions
Photo by Gabriel Crismariu on Unsplash
