CheckPoint Firewall Correlation Rule Pack - Part 3.
Last two posts were all about admin events, like logged in admins, their activities and number of events per hour. In this final part of the basic monitoring rule pack we will create dashboards that will show analysis of the dropped packets. This is quite an easy task.
Top Drop Events Analysis
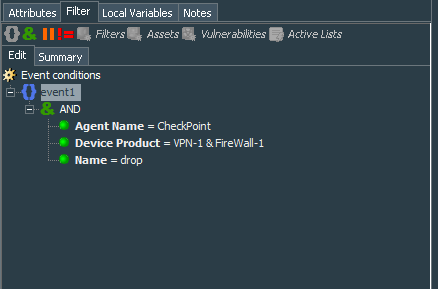
We will start with creation of the filter CheckPoint Firewall - Drop Events. Its conditions are simple, take events from specific connector that serves firewall events to the connector, narrow is down to specific product VPN-1 & FireWall-1 and finally name=drop.
This filter will be the basis that serves events for our dashboards.
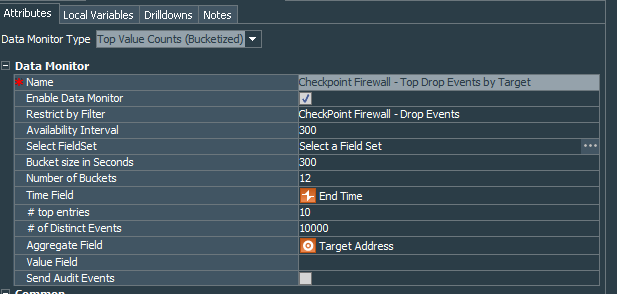
The first dashboard will be Top Drop Events by Target. Lets create the data monitor Checkpoint Events - Top Drop Events by Target. Data monitor type is Top Value Counts (Bucketized). It should be restricted by our recently created CheckPoint Firewall - Drop Events filter. # top entries equals 10. Aggregate Field is obviously set to Target Address.
Number of Buckets and # of Distinct Events should be considered according to your actual firewall event flow.
To understand better how this data monitor works, one needs to properly configure the # of Distinct Events field.
The Distinct Events value on the Data Monitor is the number of event the data monitor keeps in memory for determining the top events.
If this value is configured too high, it can cause performance issues and too low will cause improper figures to be presented for the monitoring.
In order to properly count this value we can do the following as per support page (Note: You need the active subscription to access this page):
- Create an Active List with the same conditions as the filter that you use for the data monitor.
- Time period for the Active Channel should be equal to your setting of the Bucket size in Seconds and Number of Buckets of the data monitor. If you set 300 for Bucket size in Seconds, the Data Monitor grabs all the events within that 300 seconds, or 5 minutes. If you set 12 for Number of Buckets, you have 12 buckets each holding 5 minutes worth of events so the Data Monitor will look at all the events within a 1 hour period.
- The # of Distinct Events setting indicates how many events the Data Monitor should hold. If you have 10,000 events coming in an hour and the Data Monitor can only hold 1000 events, the Data Monitor is discarding all the events it cannot handle, so it is only looking at 1000 events out of the 10,000 events received. Therefore, if you see that your active channel indicates that there are 10,000 events in 1 hour and you want data monitor to handle all the events, you should set the # of Distinct Events to 10,000. Always consider the number of events you put for this type of data monitor, cause its large number can cause significant performance hits.
Enable this data monitor and add it to our general dashboard.
Onto the next one. I find it convenient in addition to monitoring top drops by target, also try to get a clearer picture of distinguishing drops by the source to destination direction.
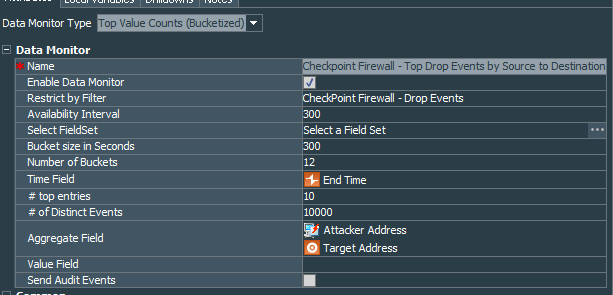
Lets create another data monitor Checkpoint Firewall - Top Drop Events by Source to Destination on the same Top Value Counts (Bucketized). This data monitor will reuse our CheckPoint Firewall - Drop Events filter. The only difference in the settings compared to the previous data monitor is that our Aggregate Field will be Attacker Address and Target Address.
To finalize our task enable data monitor and again add it to the general dashboard.
You can play with the view of those dashboards, to find the most convenient one. I have chosen Pie Chart for the Checkpoint Events - Top Drop Events by Target and Horizontal Bar Chart for the Checkpoint Firewall - Top Drop Events by Source to Destination
What’s left is properly arranging the layout of the general dashboard and its individual parts.
Mine looks like this:
Mentions
Photo by Gabriel Crismariu on Unsplash


