CheckPoint Firewall Correlation Rule Pack - Part 1.
Ok, so I am not sure if folks really liked my previous attempt to do a write up about VPN correlation rule pack, but I am going to continue nonetheless. My next series are going to be about utilizing CheckPoint events. I will not use events from next-gen features like app control, AV and others. I think it is better to address the core needs and later develop something more suitable to your licensing. My dashboard and reports will provide basic information that I find useful for the core monitoring. You can take this further and expand based on your needs.
My setup will again be quite simple. Firewall serve events to the single OPSEC connector, but same principles apply for the events served over syslog. Once again I will use ArcSight ESM, though same logic may apply to other SIEMs.
So in the next couple of posts we will cover creation of the following:
- Dashboard
- Firewall Events Trend
- Top Drop Events by Target
- Top Drop Events by Source to Destination
- Active Logins
- Last 10 Admin Actions
- Reports
- Firewall Daily Admin Activities
I hope this will be enough for your baseline CheckPoint monitoring activities in the ArcSight ESM.
Let us change strategy for this exercise and define filter conditions directly in the newly created objects. We shall start with the basic trend, showing the total number of events per hour for the last 24 hours from the firewalls to the connector. I have created this dashboard because OPSEC connector tends to be not reliable, so the flow of events shows that its health quite easy. In addition sudden increase of the events in the unusual hour can be an indicator of suspicious activity that deserves a more closer look.
Firewall Events - Overall Events Trend
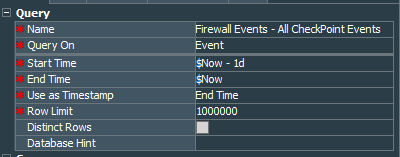
Create a query Firewall Events - All Checkpoint Events, that queries events for the dynamic period from current time to the past 12 hours.
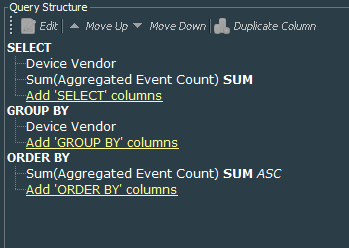
The query will select deviceVendor and will summarize Aggregated Event Count field. You can group by deviceVendor and order by the sum of Aggregated Event Count, but it does not bring any benefit to us.
Conditions define that events should be from CheckPoint connector only and should not be internal ArcSight events
Next we create a new trend Firewall Events - CheckPoint Events Count. This trend will use the Firewall Events - All Checkpoint Events query. Data fields of the query are:
- Time Stamp
- Device Vendor
- Sum of the Aggregated Event Count
It should run every hour and will use events from current time for the last hour.
After couple of hours passed you can test the trend to check if it works as expected.
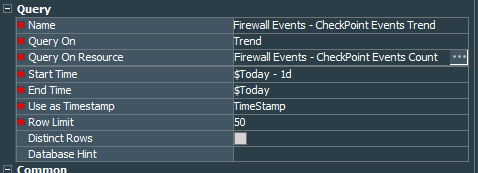
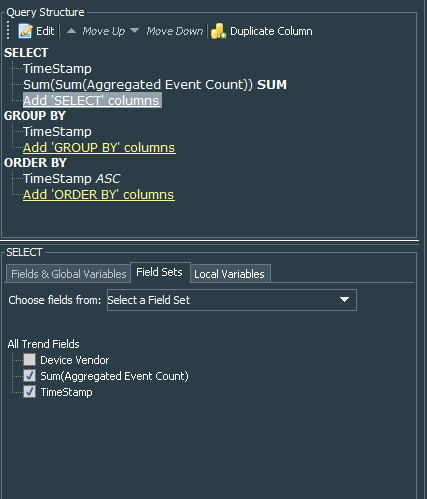
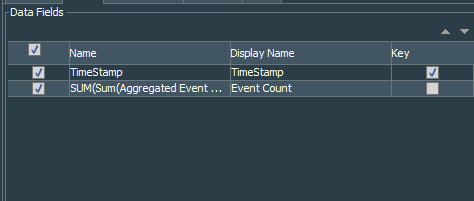
Ok. Now we should create another query Firewall Events - Checkpoint Events Trend that would query the Firewall Events - CheckPoint Events Count trend for the saved data for the 1 day period and select TimeStamp field as well as summarize the sum of the Aggregated Event Count from the trend.
Query is grouped and ordered by the TimeStamp field. Notice that I leave deviceVendor field out of the query fields, because it is no use for us at this moment.
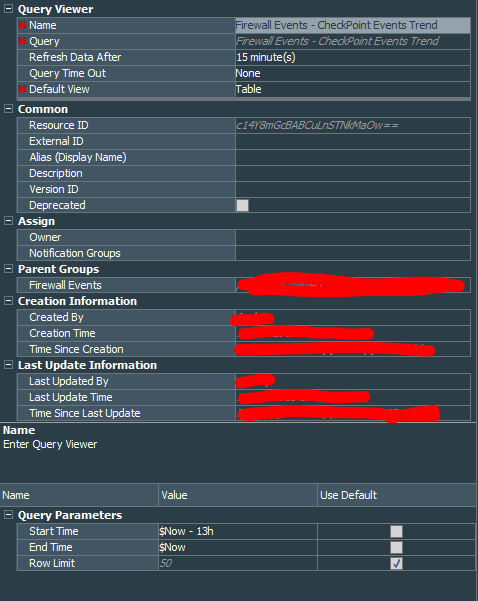
Now we need to create the Firewall Events - CheckPoint Events Trend query viewer that will work based on the Firewall Events - Checkpoint Events Trend query and actually will serve as the first piece of the dashboard. It will query data for the last 13 hours from the current moment. If you would like to see larger period, just increase the number of hours to whatever you would like.
It will use all the fields from the query.
Finally add the Firewall Events - CheckPoint Events Trend query viewer to the dashboard as Bar Chart with Time Stamp used for the X Axis and other field for the Y Axis.
By now I think you have got the logic behind building the Hourly Events trend dashboard:
- Create a query that counts all the events for specific device vendor
- Create a trend that will store data from this query on an hourly basis
- Create another query that will pull data from the trend
- Finally create query viewer that will present this data in the format you would like.
That should be enough for the first part of the series.
Mentions
Photo by Gabriel Crismariu on Unsplash


